Step 1
Open the operations overview
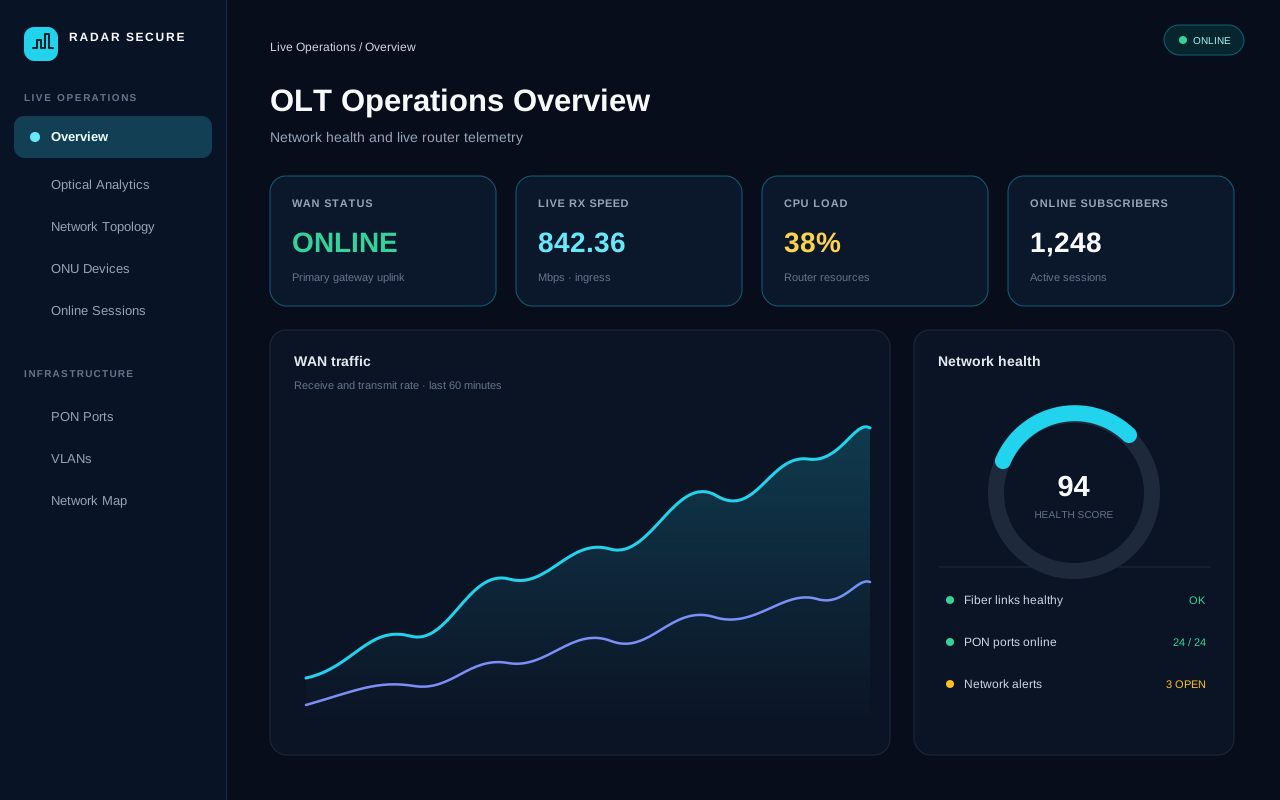
Choose Live Operations → Overview (/dashboard2?sku=olt) to access the 4-tier borderless NOC command center, featuring live optical health, interactive PON blade matrices, real-time traffic spline waves, and active incident tracking with 15s non-blocking auto-refresh.
Step 2
Interactive ONU fleet triage
Click directly on the Normal, Dying Gasp, or LOS Cut status chips in the Overview hero bar to jump into filtered views in ONU Devices (/onu-devices), Network Alerts (/olt-alerts), or Optical Analytics (/fiber-health).
Step 3
Investigate fiber health
Open Optical Analytics or PON Ports to review optical link and port status. Use Network Topology to follow connected interfaces.
Step 4
Understand high attenuation
High optical attenuation means more signal is lost along the fiber path, leaving weaker received power. Possible causes include dirty connectors, tight bends, damaged drop fiber, poor splices, or splitter-path loss. Compare readings with the installed optics and PON link budget; thresholds vary by equipment.
Step 5
Review subscriber activity
Open ONU Devices, Online Sessions, or Subscribers to investigate customer equipment and active access sessions.
Step 6
Check alerts and incident notifications
Use Network Alerts and System Logs to review operational events. High-priority gateway outages and optical faults automatically trigger trouble tickets and broadcast emergency notices to configured operations channels.